Visuals
These handle the display of our output.
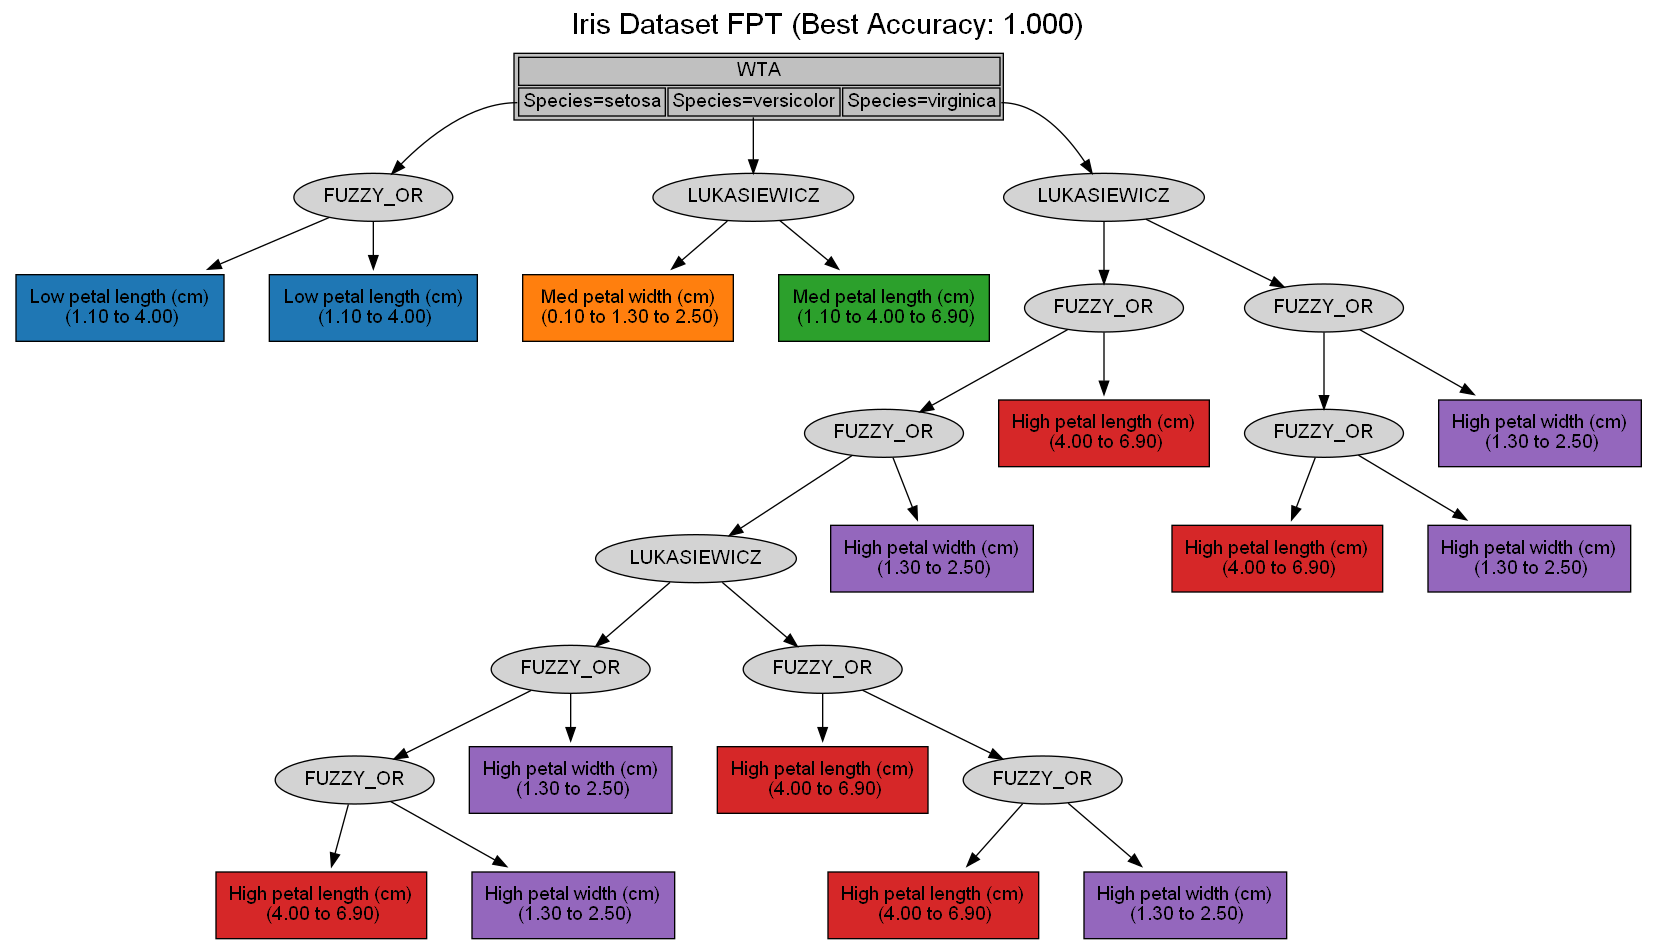
Functions for visualizing Fuzzy Pattern Trees (FPTs) and related models.
This module provides utilities to: - Generate Graphviz DOT scripts for FPT models. - Plot the evolutionary metrics of the GP sub-estimators. - Calculate and display permutation feature importances. - Plot the performance of iterative experiments.
- zuffy.visuals._add_importance(feature_metrics: List[float | int]) str[source]
Generates an HTML string to display feature importance metrics.
This function formats the mean importance, standard deviation, and rank of a feature into an HTML table row suitable for embedding in Graphviz node labels.
Parameters
- feature_metricslist of float or int, length 3
A list containing exactly three elements: [mean_importance, std_dev_importance, rank]. mean_importance and std_dev_importance should be numeric (float/int), and rank should be an integer.
Returns
- extra_htmlstr
An HTML string representing the feature’s importance metrics, formatted as a table row to be inserted into a Graphviz HTML-like label.
Raises
- ValueError
If the input feature_metrics list does not contain exactly three elements or if the mean importance is not numeric.
- zuffy.visuals._output_node(i: int, node: int | float, feature_names: List[str] | None, feature_color_assigner: FeatureColorAssigner, imp_feat: Dict[str, List[float | int]] | None = None) str[source]
Generates the Graphviz DOT string for a single node in the tree.
This function distinguishes between feature (terminal) nodes, which are integers corresponding to feature indices, and constant (terminal) nodes, which are floats. It assigns colors and optionally includes importance metrics.
Parameters
- iint
The unique integer identifier for the node within the Graphviz DOT script.
- nodeint or float
The value of the node. If an int, it represents a feature index. If a float, it represents a constant value.
- feature_nameslist of str or None
A list of string names for the input features. If None, generic ‘X0’, ‘X1’, etc., names will be used for feature nodes.
- feature_color_assignerFeatureColorAssigner
An instance of FeatureColorAssigner used to retrieve specific colors for feature nodes based on their names.
- imp_featdict, optional
A dictionary where keys are feature names and values are lists of importance metrics [mean_importance, std_dev_importance, rank]. If provided, importance information will be added to feature nodes. Defaults to None.
Returns
- dot_stringstr
The Graphviz DOT string defining the node’s properties (label, shape, color).
Raises
- ValueError
If node is an integer (feature index) but is out of bounds for the provided feature_names list.
- zuffy.visuals.graph_tree_class(program, feature_names: List[str] | None = None, start: int = 0, operator_col_fn: OperatorColorAssigner | None = None, feature_col_fn: FeatureColorAssigner | None = None, imp_feat: Dict[str, List[float | int]] | None = None) str[source]
Returns a string Graphviz script for visualizing a genetic programming program representing a class of a Fuzzy Pattern Tree.
This function generates a DOT language script that can be rendered by Graphviz to produce a visual representation of the class for inclusion in a FPT. It handles operators, features (terminals), and can optionally display feature importances.
Parameters
- programobject
The genetic programming program object (e.g., from gplearn’s _Program). Expected to have a program attribute (the FPT structure as a list of nodes) and an n_features attribute (number of input features).
- feature_nameslist of str, optional
A list of string names for the features used in the program. If None, generic ‘X0’, ‘X1’, etc., names are used. Defaults to None.
- startint, optional
An integer offset to add to node indices. This is useful when combining multiple sub-graphs into a larger Graphviz visualization to ensure unique node IDs. Defaults to 0.
- operator_col_fnOperatorColorAssigner, optional
An instance of OperatorColorAssigner to determine colors for operator nodes. If None, a default OperatorColorAssigner instance will be used.
- feature_col_fnFeatureColorAssigner, optional
An instance of FeatureColorAssigner to determine colors for feature nodes. If None, a default FeatureColorAssigner instance will be used.
- imp_featdict, optional
A dictionary where keys are feature names (strings) and values are lists of importance metrics [mean, std, rank] for displaying feature importance. If provided, importance information will be rendered on feature nodes. Defaults to None.
Returns
- dot_scriptstr
The Graphviz DOT script string representing the program’s tree structure.
Raises
- ValueError
If feature_names is provided but its length is less than program.n_features, indicating insufficient names for all features.
- zuffy.visuals.graphviz_tree(model: Any, target_feature_name: str = 'Target', target_class_names: List[str] | None = None, feature_names: List[str] | None = None, tree_name: str | None = None, imp_feat: Dict[str, List[float | int]] | None = None, output_filename: str = 'zuffy_output', source_filename: str | None = None, bg_color: str = 'white', root_bg_color: str = '#ddddff', root_text: str = 'WTA', feat_color_list: List[str] | None = None, oper_color_list: List[str] | None = None, show_fitness: bool = False) Tuple[str, Source][source]
Generates a Graphviz DOT script and renders an image for a Zuffy Fuzzy Pattern Tree model.
This function visualises the entire Zuffy model, which typically consists of multiple sub-estimators (one tree for each target class) and a central root node that represents the Winner-Takes-All (WTA) mechanism linking them.
Parameters
- modelobject
The Zuffy Fuzzy Pattern Tree model object. Expected to have the multi_.estimators_ attribute (a list of individual gplearn._Program or similar sub-estimators) and a classes_ attribute (for target labels).
- target_feature_namestr, optional
The name to display for the target feature in the root (WTA) node. Defaults to ‘Target’.
- target_class_nameslist of str, optional
A list of string names for each target class. If None, model.classes_ will be used. If model.classes_ is also unavailable, generic names like ‘Class 0’, ‘Class 1’ will be generated. Defaults to None.
- feature_nameslist of str, optional
A list of string names for the input features. If None, the function attempts to retrieve them from model.multi_.estimator.feature_names_in_ (scikit-learn standard) or model.multi_.estimator.feature_names. Defaults to None.
- tree_namestr, optional
An overall title for the entire Graphviz tree plot. If None, no title will be displayed. Defaults to None.
- imp_featdict, optional
A dictionary of feature importances. Keys are feature names (strings) and values are lists of importance metrics [mean, std, rank]. If provided, this information will be rendered on the corresponding feature nodes. Defaults to None.
- output_filenamestr, optional
The base filename for the output image file (e.g., ‘my_model’ will generate ‘my_model.png’). Defaults to DEFAULT_OUTPUT_FILENAME (‘zuffy_output’).
- source_filenamestr, optional
If provided, the generated Graphviz DOT script will also be written to this file. Defaults to None.
- bg_colorstr, optional
The background color for the entire graph. Can be a color name (e.g., ‘white’) or a hexadecimal color code. Defaults to ‘white’.
- root_bg_colorstr, optional
The background color for the central root (WTA) node. Defaults to ‘grey’.
- root_textstr, optional
The main text label to display within the central root (WTA) node. Defaults to DEFAULT_ROOT_TEXT (‘WTA’).
- feat_color_listlist of str, optional
A list of hexadecimal color codes to be used as a custom color pool for FeatureColorAssigner. These colors will be prioritised. If None, default feature colors are used. Defaults to None.
- oper_color_listlist of str, optional
A list of hexadecimal color codes to be used as a custom color pool for OperatorColorAssigner. These colors will be prioritised. If None, default operator colors are used. Defaults to None.
- show_fitnessbool, optional
If True, the raw fitness value of each sub-estimator will be displayed alongside its class name in the root node. Defaults to False.
Returns
- dot_scriptstr
The complete Graphviz DOT script string that defines the visualization.
- graphgraphviz.Source
A graphviz.Source object, which can be directly rendered or displayed.
Raises
- AttributeError
If the model object does not have the expected multi_ or multi_.estimators_ attributes, or if an individual estimator lacks the _program attribute.
- ValueError
If target_class_names is provided but its length is insufficient to represent all the sub-estimators (classes) in the model.
- zuffy.visuals.plot_evolution(model: Any, target_class_names: List[str] | None = None, skip_first_n: int = 0, output_filename: str | None = None) None[source]
Plots the evolution metrics (tree length, fitness, generation duration) for each sub-estimator in a Fuzzy Pattern Tree model over generations.
This function generates a multi-panel plot, with each row representing a target class’s evolutionary progress. It visualises average and best tree lengths, fitness values, and generation times across generations.
Parameters
- modelobject
The genetic programming model object (e.g., from gplearn’s SymbolicClassifier or SymbolicRegressor). Expected to have multi_.estimators_ (a list of sub-estimators) and classes_ attributes. Each estimator within multi_.estimators_ must also have a run_details_ attribute, containing ‘generation’, ‘average_length’, ‘best_length’, ‘average_fitness’, ‘best_fitness’, and ‘generation_time’ lists.
- target_class_nameslist of str, optional
A list of string names for each target class. If None, model.classes_ will be used. Defaults to None.
- skip_first_nint, default=0
Number of initial generations to skip from the plot. Defaults to 0. Useful for focusing on later stages of evolution where changes might be more subtle.
- output_filenamestr, optional
The full path and filename (e.g., ‘evolution_plot.png’) to save the plot. If None, the plot will be displayed interactively. Defaults to None.
Returns
- None
The function displays or saves a Matplotlib plot.
Raises
- AttributeError
If model.multi_ or model.multi_.estimators_ attributes are missing. Also, if any individual estimator in multi_.estimators_ lacks the run_details_ attribute.
- ValueError
If target_class_names is provided but its length is insufficient to represent each model class.
- zuffy.visuals.plot_evolution_consolidated(model: Any, target_class_names: List[str] | None = None, skip_first_n: int = 0, output_filename: str | None = None) None[source]
Plots the evolution metrics (tree length, fitness, generation duration) for all sub-estimators in a Fuzzy Pattern Tree model over generations, consolidating each class performance onto a single chart for comparative analysis.
Parameters
- modelobject
The genetic programming model object (e.g., from gplearn’s SymbolicClassifier or SymbolicRegressor). Expected to have multi_.estimators_ and classes_ attributes. Each estimator within multi_.estimators_ must also have a run_details_ attribute, containing ‘generation’, ‘average_length’, ‘best_length’, ‘average_fitness’, ‘best_fitness’, and ‘generation_time’ lists.
- target_class_nameslist of str, optional
A list of string names for each target class. If None, model.classes_ will be used. Defaults to None.
- skip_first_nint, default=0
Number of initial generations to skip from the plot. Defaults to 0. Useful for focusing on later stages of evolution where changes might be more subtle.
- output_filenamestr, optional
The full path and filename (e.g., ‘evolution_plot.png’) to save the plot. If None, the plot will be displayed interactively. Defaults to None.
Returns
- None
The function displays or saves a Matplotlib plot.
Raises
- AttributeError
If model.multi_ or model.multi_.estimators_ attributes are missing, or if any individual estimator lacks the run_details_ attribute.
- ValueError
If target_class_names is provided but its length is insufficient to represent all model classes.
- zuffy.visuals.plot_iteration_performance(iter_perf: ndarray, title: str | None = 'Iteration Performance', output_filename: str | None = None, col_iter_acc: str | None = '#1c9fea', col_best_iter: str | None = '#386938', col_tree_size: str | None = '#680818') None[source]
Plots the performance of experiments (iterations), typically showing accuracy and tree size over iterations.
This function is designed to visualize the progress of an iterative process, such as a hyperparameter search or sequential model building. It displays a primary metric (e.g., accuracy) and a secondary metric (e.g., tree size) on a twin Y-axis for context. It can also highlight the best performing iteration. The function displays or saves a Matplotlib plot.
Parameters
- iter_perfnumpy.ndarray
A 2D NumPy array or array-like object where each row represents an iteration and columns contain performance metrics. It’s expected to have columns for iteration accuracy and tree size, as specified by col_iter_acc and col_tree_size respectively.
- titlestr, optional
The title for the plot. If None, a default title ‘Iteration Performance’ will be used. Defaults to None.
- output_filenamestr, optional
The full path and filename (e.g., ‘iteration_performance.png’) to save the plot. If None, the plot will be displayed interactively. Defaults to None.
- col_iter_accstr, optional
The colour for the primary Y-axis, representing the iteration performance metric (e.g., ‘Accuracy’).
- col_best_iterstr, optional
The colour for the best iteration marker.
- col_tree_sizestr, optional
The colour for the secondary Y-axis, representing the tree size or complexity.
Returns
- mean_y1float
The mean value of the accuracies.
- std_dev_y1float
The standard deviation of the accuracies.
- zuffy.visuals.sanitise_names(names: List[Any] | None) List[str] | None[source]
Sanitises a list of names for safe use in HTML contexts.
Each element in the input list is converted to a string, and then HTML special characters are escaped to prevent rendering issues in Graphviz labels.
Parameters
- nameslist of Any or None
A list of names (can be any object convertible to string). If None, the function returns None.
Returns
- sanitised_listlist of str or None
A new list with sanitised string versions of the names. Returns None if the input names was None.
- zuffy.visuals.show_feature_importance(reg: Any, X_test: ndarray, y_test: ndarray, features: List[str] | None = None, n_jobs: int | None = None, n_repeats: int = 20, output_filename: str | None = None) Dict[str, List[float | int]][source]
Calculates and displays permutation feature importances for a given model.
This function computes feature importances using the permutation importance method from sklearn.inspection and then plots a bar chart of these importances. It returns a dictionary containing the detailed importance metrics.
Parameters
- regobject
The regressor or classifier model object. It must be a fitted scikit-learn compatible estimator with a predict method and a score method. The score method is used by permutation_importance to evaluate performance.
- X_testnumpy.ndarray
The test input data, used to evaluate the model’s performance during permutation.
- y_testnumpy.ndarray
The true target values for the test data.
- featureslist of str, optional
A list of string names for the input features. If None, the function attempts to retrieve names from reg.multi_.estimators_[0].feature_names_in_ or reg.multi_.estimators_[0].feature_names. If still None, generic ‘X0’, ‘X1’, etc., names will be used. Defaults to None.
- n_jobsint, optional
Number of jobs to run in parallel for permutation_importance. -1 means using all available processors. None (default) means 1 job.
- n_repeatsint, default=20
The number of times to permute a feature. Higher values increase reliability but also computation time. Defaults to 20.
- output_filenamestr, optional
The full path and filename (e.g., ‘feature_importance.png’) to save the plot. If None, the plot will be displayed interactively. Defaults to None.
Returns
- imp_feat_dictdict
A dictionary containing feature importances. Keys are original feature names (strings), and values are lists: [mean_importance, std_dev_importance, rank]. Only features with a positive mean importance (or non-zero standard deviation if mean is zero) are included.