Sample Programs
These examples provide an introduction to the Zuffy package and show some ideas of how it can be used to explore a dataset.
Example 1 - Minimal
This is a very basic implementation using the sci-kit learn Iris dataset. The program runs a number of experiments (iterations) where it generates a Fuzzy Pattern Tree on a training subset of the Iris data and it selects the best performing model from those experiments.
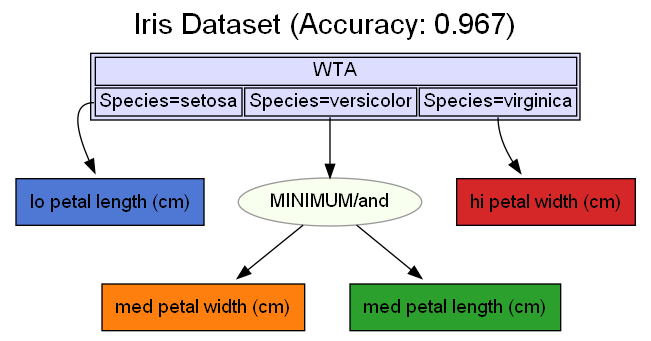
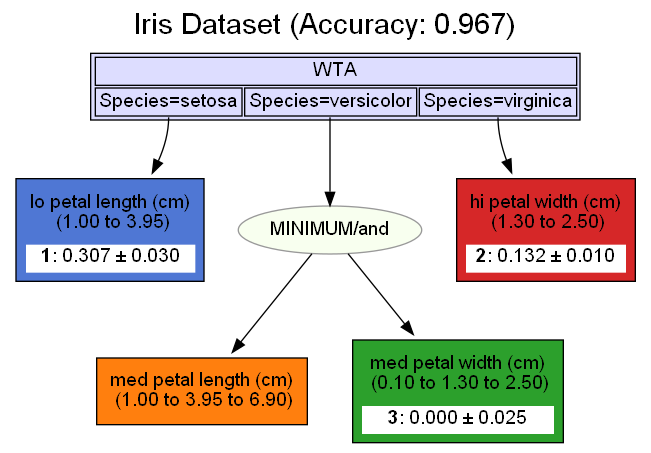
It graphs the tree showing the three classes of Iris with a Winner-Take-All root. This simplest of FPTs shows that if the plant has a low length of petal it is likely to be of the Setosa species. If the petal width is medium sized and the length is also medium sized then the species is Versicolor and if the petal width is high (i.e. long) then the species is Virginica.
 1'''
 2Zuffy Example 1 - Minimal
 3'''
 4
 5# pylint: disable=no-member
 6import pandas as pd
 7
 8from sklearn.datasets import load_iris
 9
10from zuffy import ZuffyClassifier, visuals
11from zuffy.zuffy_fit_iterator import ZuffyFitIterator
12
13iris = load_iris()
14dataset = pd.DataFrame(data=iris.data, columns=iris.feature_names)
15dataset['target'] = iris.target
16X = dataset.iloc[:,0:-1]
17y = dataset.iloc[:,-1]
18
19zuffy = ZuffyClassifier(generations=15)
20fit_iterator = ZuffyFitIterator(zuffy, n_iter=3, show_fuzzy_range=False)
21trained_iterator_results = fit_iterator.fit(X, y)
22
23visuals.graphviz_tree(
24    trained_iterator_results.best_estimator_,
25    target_class_names=list(iris.target_names),
26    target_feature_name = 'Species',
27    feature_names=trained_iterator_results.fuzzy_feature_names_,
28    tree_name=f"Iris Dataset (Accuracy: {trained_iterator_results.best_score_:.3f})",
29    output_filename=f'example1_fpt_{trained_iterator_results.best_score_*1000:.0f}')
Example 2 - Categoricals
This example uses a dataset with both numeric and categorical features.
 1'''
 2Zuffy Example 2 - Categoricals
 3'''
 4
 5# pylint: disable=no-member disable=C0103 # uppercase naming style
 6import pandas as pd
 7
 8from zuffy import ZuffyClassifier, visuals
 9from zuffy.zuffy_fit_iterator import ZuffyFitIterator
10from zuffy.fuzzy_transformer import convert_to_numeric
11
12# Use University of California, Irvine (UCI) Adult dataset (https://archive.ics.uci.edu/dataset/2/adult)
13my_data = pd.read_csv('adult.data', sep=',', header=None, skiprows=0)
14my_data.columns = ['age', 'workclass', 'fnlwgt', 'education', 'education-num', 'marital-status',
15                   'occupation', 'relationship', 'race', 'sex', 'capital-gain', 'capital-loss',
16                   'hours-per-week', 'native-country', 'income']
17
18target_name = 'income'
19target_class_names, my_data = convert_to_numeric(my_data, target_name)
20
21non_fuzzy =  ['workclass', 'education', 'marital-status', 'occupation',
22              'relationship', 'race', 'sex', 'native-country']
23
24y = my_data[target_name]
25X = my_data.drop(target_name, axis=1)
26
27zuffy = ZuffyClassifier(generations=25, parsimony_coefficient=0.00002, verbose=1)
28fit_iterator = ZuffyFitIterator(zuffy,n_iter=5)
29trained_iterator_results = fit_iterator.fit(X, y, non_fuzzy=non_fuzzy)
30
31visuals.plot_evolution(
32    trained_iterator_results.best_estimator_,
33    target_class_names=target_class_names,
34    output_filename='example2_evolution')
35
36visuals.graphviz_tree(
37    trained_iterator_results.best_estimator_,
38    target_class_names=target_class_names,
39    target_feature_name = target_name,
40    feature_names=trained_iterator_results.fuzzy_feature_names_,
41    tree_name=f"UCI Adult Dataset (Experiment Accuracy: {trained_iterator_results.best_score_:.3f})",
42    source_filename=f'example2_fpt_{trained_iterator_results.best_score_*1000:.0f}.dot',
43    output_filename=f'example2_fpt_{trained_iterator_results.best_score_*1000:.0f}')
Example 3 - GridSearchCV
The sci-kit learn package includes the GridSearchCV feature that allows a developer to specify a range of hyperparameters when building their model. This is supported by Zuffy.
 1'''
 2Zuffy Example 3 - GridSearchCV
 3'''
 4
 5# pylint: disable=no-member
 6import pandas as pd
 7from sklearn.datasets import load_iris
 8from sklearn.model_selection import GridSearchCV
 9
10from zuffy import ZuffyClassifier
11from zuffy.zuffy_fit_iterator import ZuffyFitIterator
12
13
14# 1. Load data
15iris = load_iris()
16dataset = pd.DataFrame(data=iris.data, columns=iris.feature_names)
17dataset['target'] = iris.target
18X = dataset.iloc[:,0:-1]
19y = dataset.iloc[:,-1]
20
21# 2. Define the base estimator and the parameter grid for GridSearchCV
22zuffy_model = ZuffyClassifier()
23
24param_grid = {
25    'population_size': [5, 20, 500],
26    'generations': [3, 10, 20],
27}
28
29# 3. Set up GridSearchCV
30# This will search for the best hyperparameters for the ZuffyClassifier
31# within each iteration of the ZuffyFitIterator.
32grid_search = GridSearchCV(
33    estimator=zuffy_model,
34    param_grid=param_grid,
35    cv=3,  # 3-fold cross-validation
36    scoring='accuracy',
37    n_jobs=-1, # Use all available CPU cores,
38    verbose=1 # Set to 1 to see detailed output
39)
40
41# 4. Initialize and run ZuffyFitIterator
42# It will run GridSearchCV 3 times (n_iter=3) and find the best overall model.
43fit_iterator = ZuffyFitIterator(
44    model=grid_search,
45    n_iter=5,
46    test_size=0.25
47)
48
49trained_iterator_results = fit_iterator.fit(X, y, feature_names=None)
50
51# 5. Display the results
52print(f"Best iteration index: {fit_iterator.best_iteration_index_}")
53print(f"Best score (accuracy): {fit_iterator.best_score_:.4f}")
54print(f"Smallest tree size of best model: {fit_iterator.smallest_tree_size_}")
55
56# Display the best parameters found by GridSearchCV in the best iteration
57if hasattr(fit_iterator.best_estimator_, 'best_params_'):
58    print(f"Best hyperparameters found by GridSearch: {fit_iterator.best_estimator_.best_params_}")
59
60# Show performance of each iteration
61print("\n--- Iteration Performance ---")
62print("\n   Score     Tree Size  Class Scores")
63perf_df = pd.DataFrame(fit_iterator.iteration_performance_)
64print(perf_df.to_string())
65
66# Example of using the fitted iterator to make predictions on new data
67print("\n--- Making a prediction on a 'new' data sample ---")
68# Take the last 5 samples as "new" data
69X_new = X[-5:]
70fuzzy_X_new = fit_iterator.fuzz_transformer_.transform(X_new)
71predictions = fit_iterator.best_estimator_.predict(fuzzy_X_new)
72print(f"Predicted classes: {predictions}")
73print(f"Actual classes: {list(y[-5:])}")
Example 4 - Pipeline
Because it is scikit-learn compatible, the Zuffy classifier and Fuzzy transformer can be included in pipelines to help manage more complex model generation.
 1'''
 2Zuffy Example 4 - Pipeline
 3'''
 4
 5# pylint: disable=no-member
 6import pandas as pd
 7import numpy as np
 8from sklearn.compose import ColumnTransformer
 9from sklearn.pipeline import Pipeline
10from sklearn.preprocessing import StandardScaler, OneHotEncoder
11
12from zuffy import ZuffyClassifier
13from zuffy.fuzzy_transformer import FuzzyTransformer
14from zuffy.visuals import plot_evolution
15
16
17# 1. Create a synthetic dataset
18N_SAMPLES = 100
19
20data = pd.DataFrame({
21    'age': np.random.randint(18, 70, size=N_SAMPLES),
22    'income': np.random.randint(20000, 100000, size=N_SAMPLES),
23    'gender': np.random.choice([0, 1], size=N_SAMPLES),
24    'region': np.random.choice([1, 2, 3, 4], size=N_SAMPLES),
25    'target': np.random.choice(['A', 'B'], size=N_SAMPLES)
26})
27
28X = data.drop('target', axis=1)
29y = data['target']
30
31# 2. Define preprocessing pipelines for numeric and categorical features
32numeric_transformer = Pipeline(steps=[('scaler', StandardScaler())])
33
34# Create a preprocessor with ColumnTransformer
35preprocessor = ColumnTransformer(
36    transformers=[
37        ('num', numeric_transformer, ['age','income'])
38    ],
39    remainder='passthrough'
40)
41
42# 3. Create the full pipeline including preprocessing, fuzzification, and classifier
43full_pipeline = Pipeline(steps=[
44    ('preprocessor', preprocessor),
45    ('fuzzifier', FuzzyTransformer(feature_names=X.columns)),
46    ('classifier', ZuffyClassifier(generations=35))
47])
48
49# 4. Fit the model
50pipeline_results = full_pipeline.fit(X, y)
51
52# 5. Display the results
53print(f"Fuzzy Feature Names: {pipeline_results.named_steps['fuzzifier'].feature_names_out_}")
54
55plot_evolution(
56    model=pipeline_results.named_steps['classifier'],
57    target_class_names=['A', 'B'],
58    output_filename='example4_evolution'
59    )
60
61print("Run Details:")
62print(pipeline_results.named_steps['classifier'].multi_.estimators_[0].run_details_)
Example 5 - Full Visuals
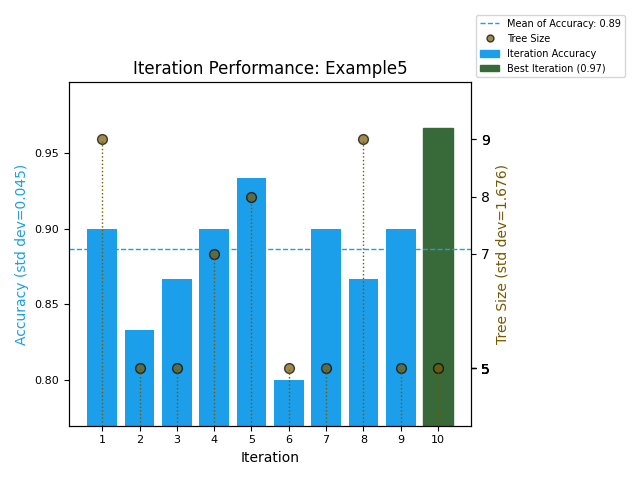
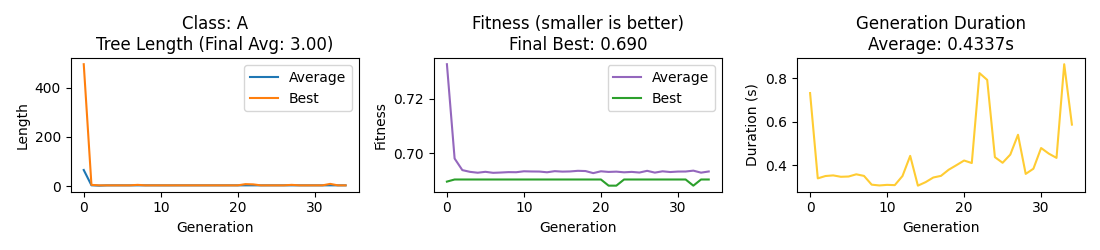
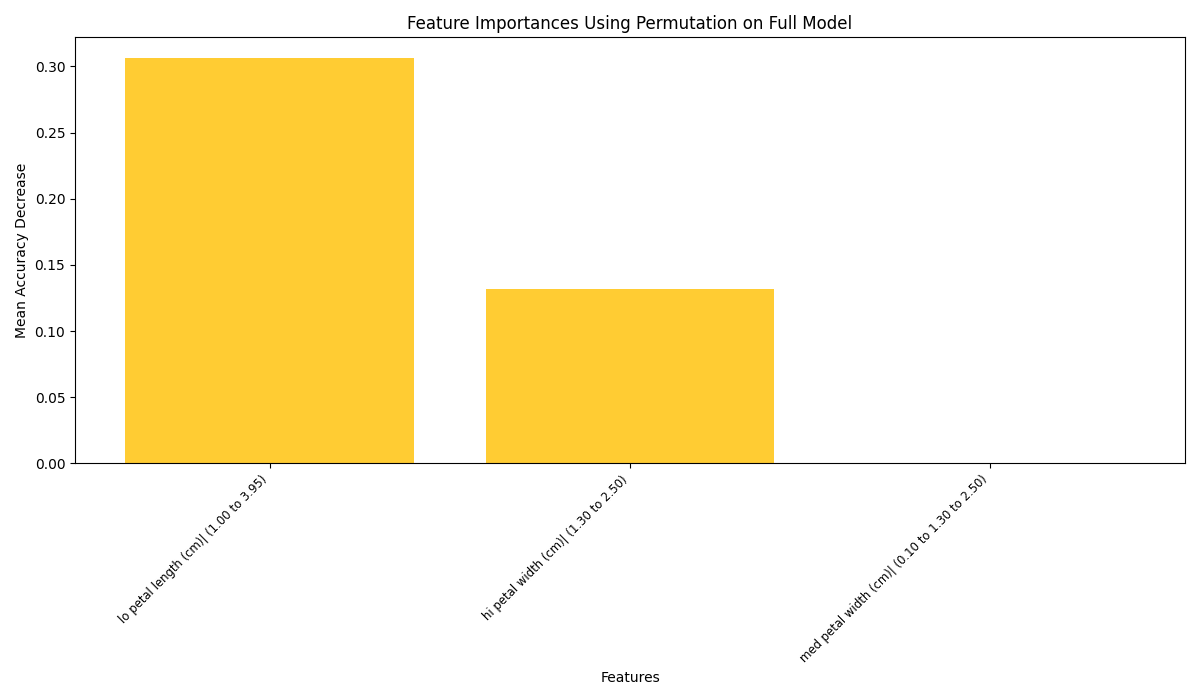
The Zuffy visuals module includes four plots to facilitates visualisation of the induction process and the performance across multiple experiments.
 1'''
 2Zuffy Example 5 - Full Visuals
 3'''
 4
 5# pylint: disable=no-member
 6import pandas as pd
 7
 8from sklearn.datasets import load_iris
 9
10from zuffy import ZuffyClassifier
11from zuffy.visuals import (
12                        show_feature_importance,
13                        plot_evolution,
14                        graphviz_tree,
15                        plot_iteration_performance
16                        )
17from zuffy.zuffy_fit_iterator import ZuffyFitIterator
18
19iris = load_iris()
20dataset = pd.DataFrame(data=iris.data, columns=iris.feature_names)
21dataset['target'] = iris.target
22X = dataset.iloc[:,0:-1]
23y = dataset.iloc[:,-1]
24
25zuffy = ZuffyClassifier(generations=15, parsimony_coefficient=0.0002)
26fit_iterator = ZuffyFitIterator(zuffy, n_iter=10, show_fuzzy_range=True)
27trained_iterator_results = fit_iterator.fit(X, y)
28
29best_zuffy_model = trained_iterator_results.best_estimator_
30best_overall_score = trained_iterator_results.best_score_
31fuzzy_feature_names = trained_iterator_results.fuzzy_feature_names_
32iter_perf = trained_iterator_results.iteration_performance_
33
34feature_importance_results = show_feature_importance(
35    reg=best_zuffy_model,
36    X_test=best_zuffy_model.X_,
37    y_test=best_zuffy_model.y_,
38    features=fuzzy_feature_names, # Use fuzzified feature names for this plot
39    n_jobs=1,                     # Number of parallel jobs (-1 for all processors)
40    n_repeats=5,                  # Number of permutations
41    output_filename='example5_feat_imp'
42)
43
44# Plot Evolutionary Metrics (e.g., fitness and length over generations)
45plot_evolution(
46    model=best_zuffy_model,
47    target_class_names=list(iris.target_names),
48    output_filename='example5_evolution'
49)
50
51graphviz_tree(
52    trained_iterator_results.best_estimator_,
53    imp_feat=feature_importance_results,
54    target_class_names=list(iris.target_names),
55    target_feature_name = 'Species',
56    feature_names=fuzzy_feature_names,
57    tree_name=f"Iris Dataset (Accuracy: {trained_iterator_results.best_score_:.3f})",
58    output_filename='example5_fpt')
59
60plot_iteration_performance(
61    iter_perf,
62    title='Iteration Performance: Example5',
63    output_filename='example5_iter_perf'
64    )
This plot shows the relative importance of key features in the dataset.
This FPT includes the feature range and a measure of their importance.
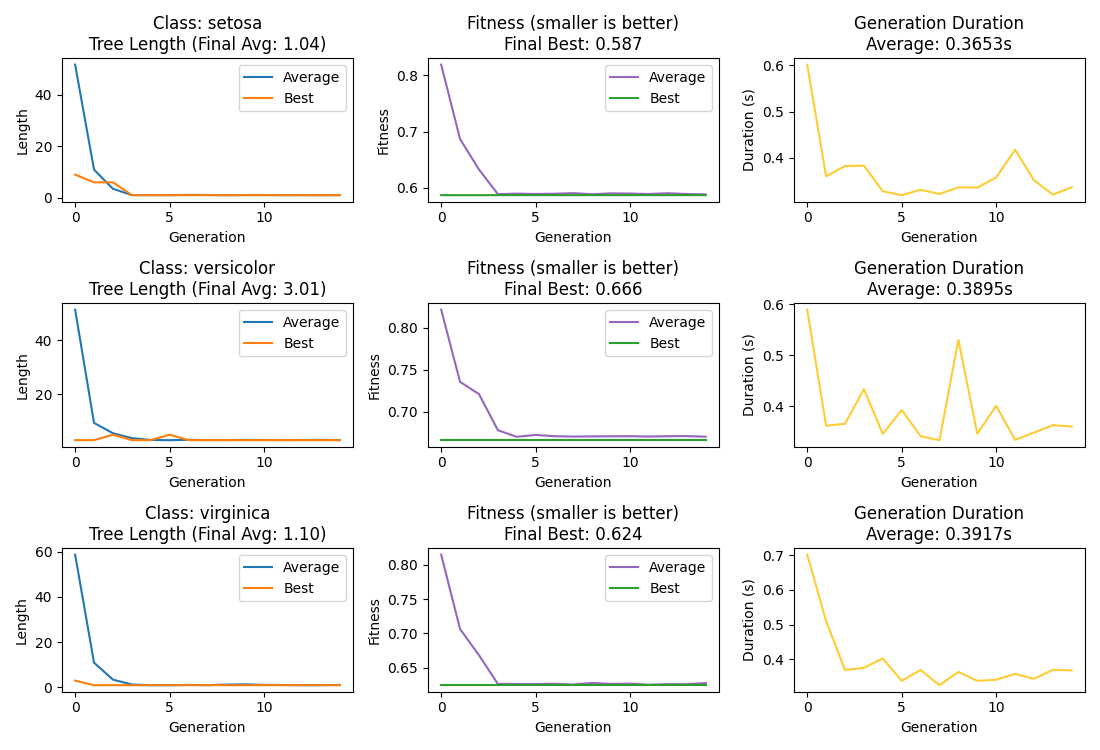
This plot shows the evolution metrics for each class in the best FPT.
Each of the experiments can be graphed using the plot_iteration_performance function. The graph shows the result of each experiment with the accuracy on the left axis and the tree size on the right.